Expectation Ratings: a methodology to quantify the user experience
As part of the day to day challenge of being a Product Manager, the launch of a new product issuper important, especially if we’re going on the right track. Within this context, I would like to share the methodology I used to quantify and validate the user experience when I prototyped the first version of the product I would release after 3 months: the Expectation Rating, created by Albert and Dixon (2003).
Expectation Ratings: How the procedure works
The methodology draws a comparison between how easy or difficult it is to perform an action on your product and compares it with the perception of complexity that it had before this action began. Both the expectation and the reality about performing a given task are ranked on a scale from (1) very easy to (7) very difficult. With this, after performing the test it is possible to construct a matrix divided in four quadrants, as shown in the figure below:
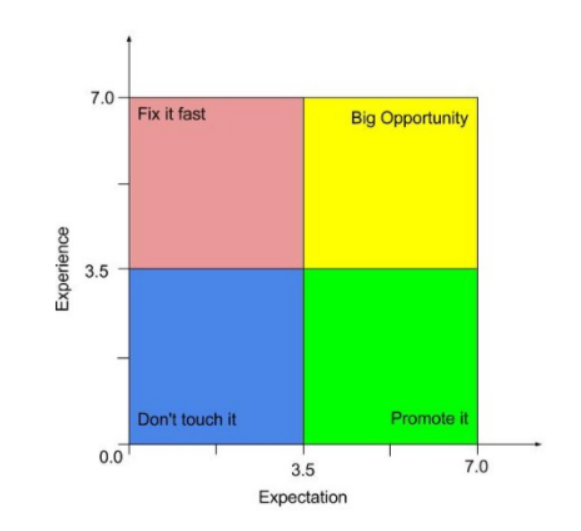 * Figure 1: Illustration of the four quadrants proposed by Tullis and Albert (2008) to categorize the dispersion of the ER methodology rankings.
Do not touch it: tasks that users rated as easy before and after their execution. So it is feasible that no action is taken in relation to them. Promote it: tasks that users had the perception of being difficult before execution, but were classified as easy after it. At this point it is worth reflecting on how to promote this functionality. Fix it fast: tasks that the participants thought were easy, but turned out difficult during the test , which is nothing more than an indicator of high user dissatisfaction. This is the quadrant with the highest priority to make changes. Big Opportunity: tasks that users defined as difficult before and after their accomplishment. This is a good opportunity to make improvements and move the tasks to the “Promote it” quadrant. Best cases to apply this methodology
This methodology showed great value in validating the solution of a new product. It brought inputs that helped me reflect on the evolution of the product from its previous version, and also how the product ratings are compared to the largest competitor in that segment.
In my case, I was testing a high-fidelity functional prototype of the new RD Station email editor.
Planning and Execution
The process of developing the test scenario, scheduling, executing and analyzing the results can take around two weeks. In this Resultados Digitais article there is a guide on how our designers conduct usability testing. To illustrate, here’s the step by step I ran to apply the ER:
Set test tasks and user profile The first step is to define the tasks that will be evaluated and the profile of the participants of the tests. In my case, I selected a group with very different profiles, because the functionality I was testing would be launched for the whole RD Station clients base. So, my tests should include profiles with different levels of engagement with the platform (from light users to heavy users) and different types of accounts, inbound and partners, from different RD Station plans. The tasks were chosen from different perspectives, such as issues raised by the Customer Success department, support tickets and issues reported by the product team itself.
Create a test scenario In my product team we usually use high-fidelity functional prototypes to perform usability tests that are also a key part of every stage of sprints planning and execution - in general, the prototype is used as the acceptance criterion for the product release and helps the engineering team understand how the product works, the business rules and behavior of the interface.
Well, the first step was to turn the prototype into a functional interface with the links and key actions working: for example, I could drag and drop a text component to build my email template.
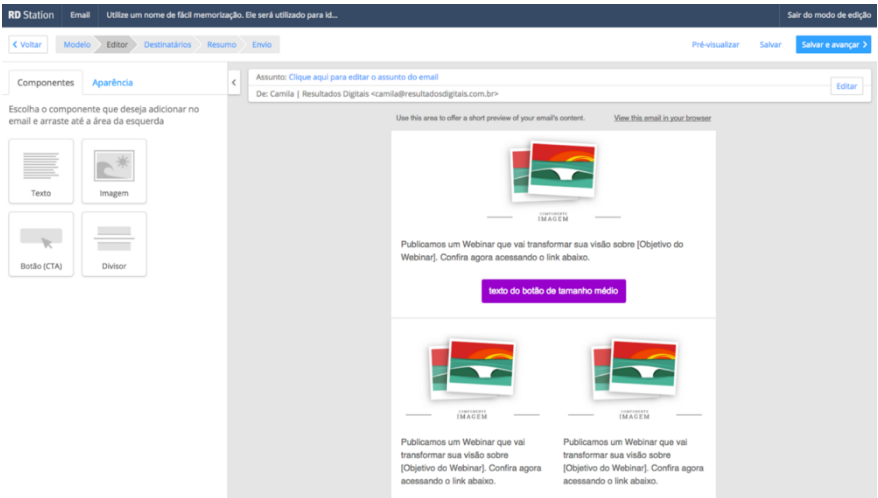 * RD Station prototype
The next step was, in fact, to build the test scenario, listing all the tasks that participants should perform. In my case, the fictitious scenario was to create an email campaign to promote a rich material.
Step by step of the usability test The tests were conducted on Skype, with screen sharing. It was essential to record all the tests, both screen and audio, for further consultation in order to compile the results. One important piece of advice is to leave a standard email ready to be sent to the user moments before the test begins, containing some important instructions and files that will be used during the interview. In my case they were an ebook file, images and texts to assemble the email marketing.
A test scenario had the following structure: Presentations and thanks for the user’s time. Main guidelines for the test. Questions about the user (name, function within the company, size of the marketing team, etc.). Frequency of use of the email tool. Explanation of the test scenario.
My test scenario (item 5) had the format below:
“You work in the marketing department of a Dental Clinic and have planned to create a campaign for your base’s Leads to advertise your new eBook. Well, now I’d like you to access your email to download the files and perform the first task.”
“Task 1. Insert the logo that you received by email in your template.”
At this point, before the test begins, ask the user:
“How difficult or easy do you expect this task to be? 1 - very easy … 7 - very difficult”
And after their performing the test, again you ask:
“How difficult or easy did you think it was to accomplish this task? 1 - very easy … 7 - very difficult”
Ideally, you should never take the test alone. Preferably ask a designer who did not participate in the solution to conduct the interview in order to avoid interference or some biased action.
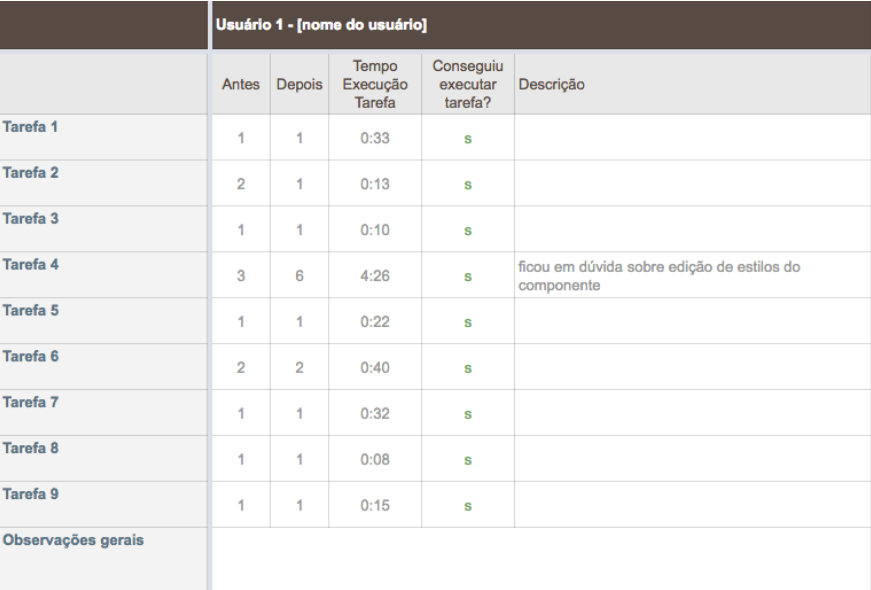
Results and learnings The test results were compiled into a worksheet as shown below:
 * Tests Results
Overall, I record the ratings for ER calculation, the execution time of each task, whether or not the user was able to perform the action, and some more pertinent information. For each task I calculated the average of the grades and plotted the graph to evaluate the ER. The test result for the prototype of the new email editor was as shown below:
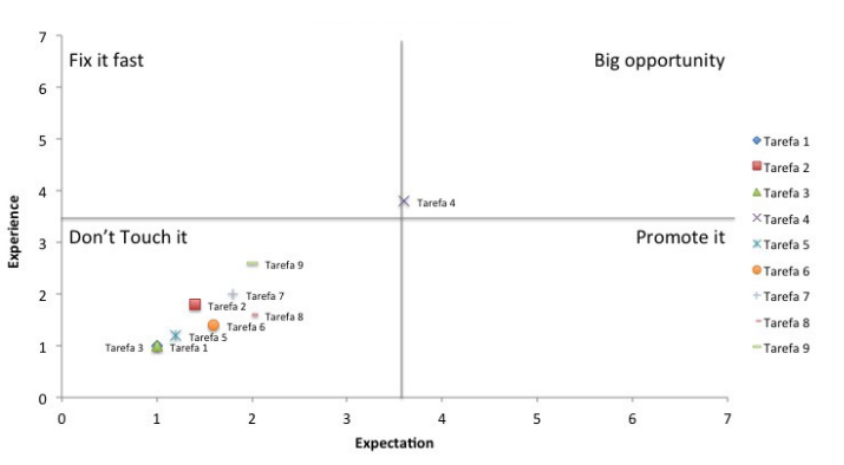 * Expectation Ratings
The chart shows that most of my tasks were located in the “Do not touch it” quadrant, and the actions performed on the prototype of the new email editor were classified as easy before and after they were performed. Also, I had a task that was left in the quadrant “Big opportunity”, that is, it was a task in which both the expectation and the experience were classified as difficult - and later it became a point of improvement that we were able to implement before the Product Launch. In this case, the task was based on a more complex edition in the email template, and the exact location for editing that style was not clear to the user - that performed as an input to improve the product interface.
Conclusion The results were essential to the development stage of the new Email Marketing Editor of RD Station. As it was a project of great investment and impact for the company, the ER methodology brought valuable learning not only about the actions defined in the test, but it was also a rich source of insights and improvements to be implemented in the product afterwards, and to ensure a successful launch during the RD Summit. In addition, Expectation Rating is today a powerful tool for the RD Product team to evaluate quantitatively the usability of the platform.
How about you, have you used any other methodology to quantify the user experience?